
At Eksneks Agency, we take over a lot of legacy projects. When you inherit a codebase, you usually expect a few skeletons in the closet: maybe some outdated dependencies, a few hardcoded passwords, or some confusing architectural choices. But recently, we encountered a digital skeleton that had grown so massive it was actively suffocating the application.
It started with a frantic alert: a Node.js API was repeatedly crashing. When we pulled up the PM2 monitor, the dashboard was painted in red flags. The application had restarted 314 times in a single day. The event loop latency was practically nonexistent, and there were zero active requests coming in, yet the memory usage was pinned at a staggering 97.35%.
The Node.js heap was maxed out at exactly 301.41 MiB out of a 309.60 MiB limit. The application was stuck in a classic “death loop.” It would start up, instantly run out of memory, crash, and let PM2 restart it, only to hit the exact same wall milliseconds later.
The client assured us: “We only have a few tables and not that much data.” As seasoned developers know, “not that much data” is a highly subjective phrase. We had to put on our digital archaeologist hats, dive into the terminal, and figure out what was eating the server alive. What we found is a perfect case study in why unchecked logging and poor architectural decisions in legacy code will inevitably lead to catastrophic failure.
Step 1: Diagnosing the PM2 “Out of Memory” Error
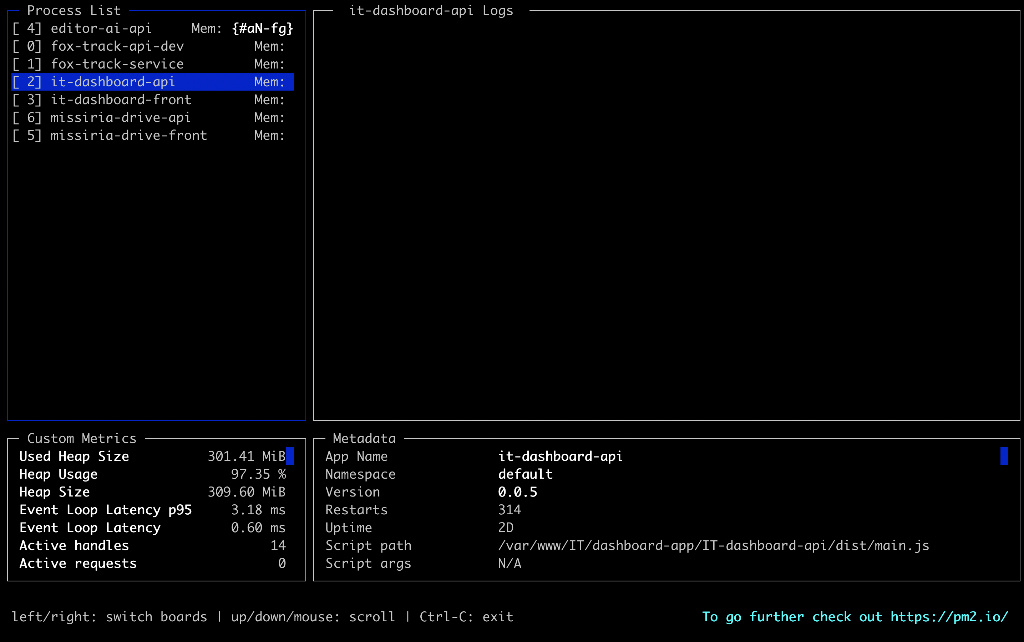
When a Node.js application crashes with an Out of Memory (OOM) error despite having zero active user traffic, the culprit is almost always in the startup sequence. The application is trying to load something massive into memory before it even begins listening for HTTP requests.
Node.js, by default, is surprisingly conservative with its memory allocation. Depending on the environment, it often caps the heap size around 300MB to 512MB. If you have a poorly optimized database query—like a SELECT * FROM table without pagination—running on a large table during startup, Node.js will try to parse thousands of raw SQL rows into heavy JavaScript objects.
The heap fills up instantly, the garbage collector panics, and the process dies.
Our first temporary fix was to give PM2 more breathing room so we could at least keep the API alive long enough to investigate. We increased the memory limit to 1GB using the max-old-space-size flag:
Bash
pm2 restart it-dashboard-api --node-args="--max-old-space-size=1024"
This stopped the immediate crashing, but it was just a band-aid. The underlying disease was still there. We needed to look at the database.
Step 2: The MySQL Investigation
We logged into the MySQL terminal to verify the client’s claim that they only had “a few tables.” Rather than running a simple SELECT COUNT(*), which doesn’t tell the whole story about storage footprint, we queried the information_schema.TABLES view. This is the most accurate way to diagnose database bloat because it accounts for data length, index length, and fragmentation.
We ran the following query to get a bird’s-eye view of the database sizes:
SQL
SELECT
    table_schema AS "Database",
    ROUND(SUM(data_length + index_length) / 1024 / 1024, 2) AS "Size (MB)"
FROM information_schema.TABLES
GROUP BY table_schema;
The output was the smoking gun we were looking for. While the default MySQL databases and a secondary project database hovered around 2 to 5 Megabytes, the production API database—pro_it-dashboard-api—was a monolithic 3,895.97 MB.
Nearly 4 Gigabytes of data. For a simple API that supposedly had “not that much data,” this was absurd.
We needed to drill down further to find the specific tables hoarding this space:
SQL
SELECT
    table_name AS "Table",
    ROUND(((data_length + index_length) / 1024 / 1024), 2) AS "Size (MB)",
    table_rows AS "Approx Rows"
FROM information_schema.TABLES
WHERE table_schema = "pro_it-dashboard-api"
ORDER BY (data_length + index_length) DESC;
The results were staggering. The actual business data—orders, users, products—accounted for less than 1 MB combined. The rest of the 3.8 GB was entirely consumed by just two tables:
logs: 2,199.09 MB (Approx. 315,765 rows)audit_logs: 1,696.03 MB (Approx. 328,422 rows)
Doing the math, that averages out to roughly 7 Kilobytes per row. In the world of relational databases, a 7KB row is remarkably “fat.” These weren’t simple timestamps and status codes; these tables were packed with massive JSON payloads, complete error stack traces, and detailed request headers.
Worse, upon inspecting the data, we realized the audit_logs table was storing raw Nginx web server logs.
Step 3: Deconstructing the Legacy Mindset
At Eksneks Agency, we spend a lot of time analyzing why legacy code is written the way it is. When previous developers build features, they often make decisions that solve an immediate problem but create a time bomb for the future.
The “Just in Case” Mentality
Why didn’t the old developers limit the number of logs? It usually comes down to a mix of fear and incomplete feature development. Developers log everything “just in case” they need to debug a weird error six months down the line. They build the “Write” function to insert logs into the database, but they never build the “Cleanup” function (like a daily Cron job) to delete old ones.
The reality is that a log entry from a year ago is useless. If a bug occurred 12 months ago and it hasn’t been fixed yet, that old log isn’t going to help you solve it today. Furthermore, keeping 3.8GB of logs makes the application so slow and unstable that you can’t even run the app to debug current issues.
The Nginx Anti-Pattern
Finding Nginx traffic logs inside a MySQL relational database is a massive architectural red flag. Why did they do it? Likely because the previous developers wanted to build an admin dashboard that showed live web traffic without having to SSH into the server to read flat files.
While that sounds convenient for the admin, it is a performance nightmare for the server.
Standard practice dictates that Nginx should write to text files (e.g., /var/log/nginx/access.log). Operating systems are incredibly efficient at appending text to files, and built-in utilities like logrotate automatically compress and delete old logs without you ever having to write a line of code.
By forcing Nginx logs into MySQL, the application was forcing the database to do heavy lifting for every single HTTP request. Every loaded image, every CSS file, every 404 error required a full database transaction, an index update, and disk I/O. It was a textbook example of using the wrong tool for the job.
Step 4: The Battle to Reclaim the Server
Knowing the problem is only half the battle; fixing it without bringing down the production database is the other.
Our first instinct was to perform a surgical cleanup—keep the last 7 days of logs and delete the rest:
SQL
DELETE FROM logs WHERE created_at < NOW() - INTERVAL 7 DAY;
MySQL immediately fired back: ERROR 1205 (HY000): Lock wait timeout exceeded; try restarting transaction.
Because PM2 was constantly restarting the crashing API, the Node.js application was instantly opening connections to the logs table on every boot. The database engine was struggling to manage the indexes of a 2GB table, creating a metadata lock. Our manual DELETE command was stuck in a queue behind the API’s own failing requests.
To break the deadlock, we had to silence the application entirely.
- Stop the API:
pm2 stop it-dashboard-api - Kill Ghost Processes: We ran
SHOW PROCESSLIST;in MySQL, found the stuck queries, and terminated them using theKILL [Id]command.
With the database finally quiet, we ran the DELETE command again. It worked, dropping over 230,000 rows. But we weren’t done.
The InnoDB Optimization Trap
Here is a crucial detail about MySQL’s default InnoDB storage engine: when you run a DELETE command, MySQL does not actually shrink the physical file size on your hard drive. It simply marks those deleted rows as “empty space” to be overwritten later.
If you check your information_schema after a massive DELETE, the database will appear to be the exact same size. To actually reclaim the disk space and reduce the memory overhead, you must defragment the table:
SQL
OPTIMIZE TABLE logs;
OPTIMIZE TABLE audit_logs;
InnoDB doesn’t support traditional optimization; instead, it performs a “recreate + analyze” operation. It essentially rebuilds the entire table from scratch, leaving out the empty holes. After this process completed, the database size plummeted from 3.8 Gigabytes down to a few Megabytes.
The Nuclear Option: TRUNCATE
In many legacy emergencies, if the DELETE logic fails (for example, if all the logs were generated in a massive spike over the last 3 days, rendering date intervals useless), the best path forward is the nuclear option:
SQL
TRUNCATE TABLE logs;
TRUNCATE TABLE audit_logs;
Unlike DELETE, which logs every single row removal, TRUNCATE simply drops the table and recreates an empty shell. It is instantaneous, bypasses the need for OPTIMIZE TABLE, and guarantees that the storage footprint resets to zero. When a system is crashing, preserving debugging logs from last Tuesday takes a backseat to keeping the server online.
Step 5: Future-Proofing the Architecture
Clearing the database stabilized the PM2 dashboard immediately. Heap usage dropped from 97% to a healthy 15%, and the restart loop ceased entirely. But at Eksneks Agency, we don’t just put out the fire; we fireproof the building.
To ensure this client never faced this issue again, we implemented three mandatory architectural changes:
1. Stop Application-Level Infrastructure Logging We scoured the Node.js codebase for the middleware—likely a misconfigured Winston, Pino, or Morgan logger—that was pushing raw web traffic into the MySQL database. We disabled it. We let Nginx go back to writing to its native flat files, entirely removing the database bottleneck for basic web requests.
2. Implement Automated Log Rotation For the business-critical audit logs we did want to keep, we set boundaries. We wrote a lightweight Cron job within the application that runs nightly:
JavaScript
// Nightly cleanup task
const cleanupOldLogs = async () => {
    try {
        await db.execute("DELETE FROM audit_logs WHERE created_at < NOW() - INTERVAL 14 DAY");
        console.log("Legacy logs cleared successfully.");
    } catch (error) {
        console.error("Failed to clear logs:", error);
    }
};
By enforcing a strict 14-day retention policy, the database will never again grow to a size that threatens the server’s memory limits.
3. Adjust Node.js Environment Limits Finally, we permanently updated the PM2 ecosystem file to give Node.js a 1GB memory limit. While the database was now lean, assigning a modern application only 300MB of RAM is asking for trouble during traffic spikes. Updating the max_memory_restart and node arguments in PM2 ensures the app has the overhead it needs to process complex tasks safely.
The Takeaway for Managing Legacy Code
Inheriting legacy code isn’t just about reading other people’s logic; it’s about understanding the compromises they made and fixing the ones that threaten the system’s stability.
“Data hoarding” is one of the most common, yet easily preventable, causes of application crashes. Logs are meant to be temporary diagnostic tools, not permanent historical records stored in premium relational databases. If your PM2 dashboards are flashing red and your memory is exhausted, don’t just throw larger servers at the problem. Dive into your database, check your table sizes, and don’t be afraid to take out the digital trash.